
Taken Together -- CPI, PPI, and Retail Sales -- Hint of Stagflation
Taken Together -- CPI, PPI, and Retail Sales -- Hint of Stagflation

Persistently rapid inflation now lowers the odds favoring a first-half 2024 cutting of the federal funds rate. Both February’s CPI and PPI topped expectations. In response, Treasury yields rose.
The 10-year Treasury yield finished the week-ended March 15 at 4.32% -- up from March 8’s 4.09% and the highest close since the 4.33% of February 22, 2024. Even more arresting was March 15’s 4.74% 2-year Treasury yield, which was the highest such close since the 4.84% of November 27, 2023.
Compared to the previous week’s probabilities, the odds favoring a Fed rate cut fell from 24.1% to March 15’s 6.5% for the FOMC’s May 1 meeting and from 73.4% to March 15’s 58.8% for the FOMC’s June 12 meeting.
Were it not for a smaller than expected reading on February’s retail sales that included downward revisions for the two preceding months, interest rates would be even higher and last week’s sell-off of equities would have been deeper.

Supremely confident markets swell longer term risks …
The ICE high-yield bond spread narrowed from March 8’s 320 basis points (bp) to March 15’s razor thin 310 bp. Not since mid-January 2022 has this high yield spread remained under 320 bp for any length of time. However, unlike March 15’s 7.79% speculative-grade bond yield, the junk bond yield was a much lower 4.62% in mid-January 2022.
Apparently, recent buyers of high-yield bonds are very confident of a drop by benchmark Treasury yields that will not be the offshoot of diminished corporate cash flows. Nevertheless, the record favors a materially wider high-yield bond spread by March 2025 given today’s atypically thin high-yield bond spread.
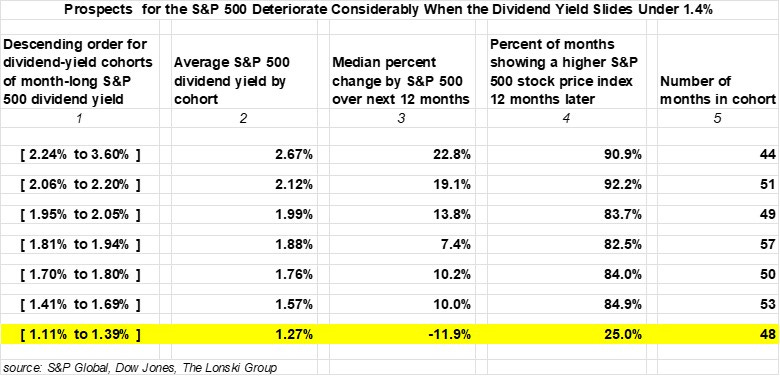
In addition to the now svelte high-yield bond spread, an atypically low S&P 500 dividend yield of 1.38% reflects the market’s assignment of a very high probability to a soft landing that includes a material drop by benchmark interest rates.
According to a record of monthly averages commencing in January 1994, the percent of months showing a higher S&P 500 stock price index 12 months out sinks from 84.9% to 25.0% when the range of the S&P 500’s dividend yield declines from [1.41% to 1.69%] to [1.27% to 1.39%]. Also, the same comparison shows a radical plunge by the median percent change for the S&P 500 stock price index from +10.0% to -11.9%, respectively.
Neither is residential real estate a bargain …
In addition to the equity and corporate credit valuations, residential real estate prices also show signs of being unsustainably high. Since the months just prior to COVID’s March 2020 outbreak, the 18.5% average annualized growth rate for the monthly payment on a new 30-year mortgage based on the median sales price of an existing home far outran the accompanying 4.0% average annualized growth rate for median family income.
Also, Q4-2023’s market value of owner occupied residential real estate was 2.24-times as great as disposable personal income. The latest ratio was far above yearlong 2019’s 1.82:1 ratio, or when the average 30-year mortgage yield of 3.93% was far less than the recent 6.80%.
Moreover, the latest ratio of housing’s market value to disposable personal income resembled the 2.39:1 average of 2005-2006 that led to a subsequent extended bout of severe home price deflation. A drop by the average 30-year mortgage yield from 2006's 6.41% to 2007's 6.33% and 2008's 6.04% was not deep enough to stabilize housing. Once again, we may be underestimating the depth of the remedial decline by benchmark interest rates in response to the next recession.
Retail sales report lowers outlook for Q1-2024’s real consumer spending …
February’s 0.6% monthly rise fell far short of compensating for January’s -1.1% downwardly revised monthly plunge by retail sales. Worse yet, not only was January’s monthly drop by retail sales revised down from -0.8% to -1.1% but December 2023’s monthly increase was slashed from 0.4% to a restated 0.1%.
Taken together, February’s smaller than anticipated monthly rise by retail sales and the downward revisions of the prior two months lowered forecasts of first-quarter 2024’s real consumer spending. For example, the Atlanta Fed’s GDPNow model cut its projection for the annualized quarterly growth rate of Q1-2024’s real consumer spending from 3.4% to 2.2%.
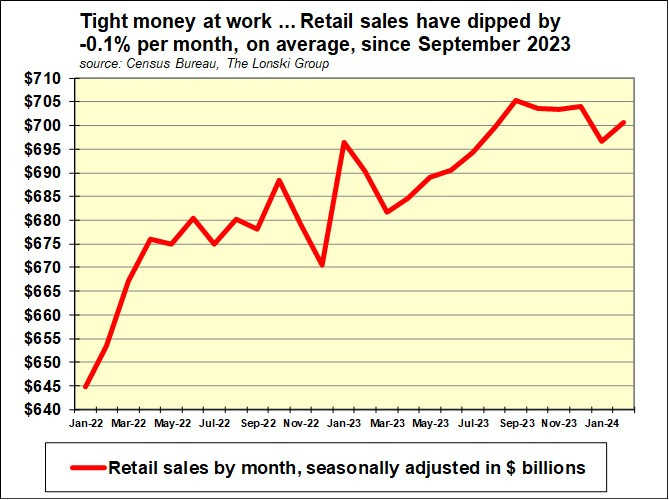
In terms of seasonally adjusted readings, February’s retail sales may have topped January 2024’s estimate by 0.6% but still left February’s retail sales under each of its monthly readings for the final four months of 2023.
Indicating an unfolding lull in consumer spending, the average monthly change by retail sales plunged from the +0.6% increase of January-September 2023 to the -0.1% dip of October 2023 through February 2024.
After excluding gasoline station sales, the average monthly percent change for the remainder of retail sales slumped from the +0.6% of January-September 2023 to the -0.03% of October 2023 through February 2024. By no means can retail sales latest trend be described as “strong”. If anything, retail sales are trending flat to lower.
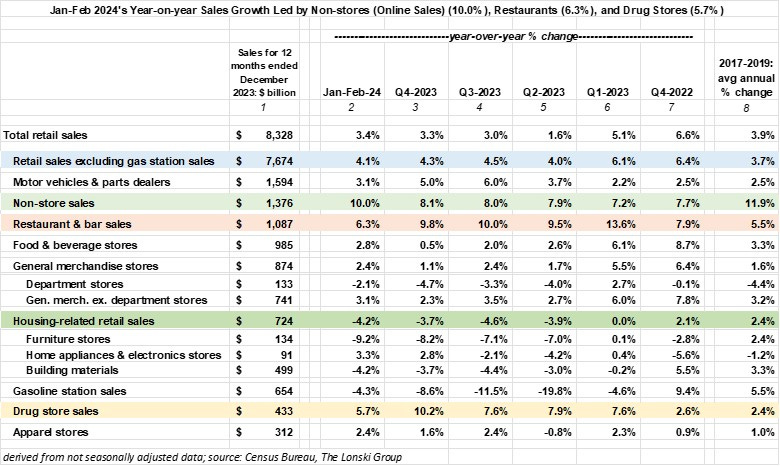
A look at January-February 2024’s year-on-year growth rates across retail sales’ major categories suggests that consumer spending’s supposed strength has not been broadly distributed. January-February’s 3.4% annual rise by retail sales edged up from Q4-2023’s 3.3% but was well below Q1-2023’s 5.1%. Moreover, retail sales grew by a faster 3.9% annually, on average, during 2017-2019.
After excluding volatile gasoline station sales, the remainder of retail sales grew by 4.1% year-over-year during January-February 2024, which was slower than both Q4-2023’s 4.3% and Q1-2023’s 6.1% but faster than 2017-2019’s 3.7% average annual pace.
Only three of 12 retail sales categories exhibited strength during January-February 2024 and posted a year-on-year increase of at least 3.4% annually.
The fastest growing categories were the 10.0% of non-store sales (which include on-line retailers), the 6.3% of restaurant sales, and the 5.7% of drug store sales. In addition to price hikes, the unprecedented aging of the US population helps to explain the relatively rapid growth of sales at restaurants and drug stores. Greying boomers are well past the age where they are either slaves to fashion or the conspicuous consumption of durable goods.
The favored discretionary spending of retirees might well be concentrated on travel and dining. Regarding the latter two categories, February’s CPI revealed year-on-year rates of change of -6.1% for commercial airline fares, -0.4% for lodging away from home, +3.6% for alcoholic beverages consumed away from home, and +4.5% for food consumed away from home. However, commercial airfare inflation excludes new charges placed on baggage. Moreover, none of the inflation measures account for “shrinkflation”.
Middling yearly sales growth rates of less than 3.4% for January-February were reported by motor vehicles & parts dealers (3.1%), food & beverage stores (2.8%), general merchandise stores less department stores (3.1%), home appliance & electronics stores (3.3%), and apparel stores (2.4%).
Also, for January-February, material yearly sales declines were incurred by furniture stores (-9.2%), building material stores (-4.2%), gasoline stations (-4.3%), and department stores (-2.1%).
Finally, deep slumps in existing home sales and home improvement spending explained January-February’s -4.2% year-over-year drop by housing-related retail sales.