

Stocks and Bonds Have Incorrectly Downplayed Deep Initial Rate Cuts

Take cover if Treasury bond yields do not soon mimic Fed rate cuts …
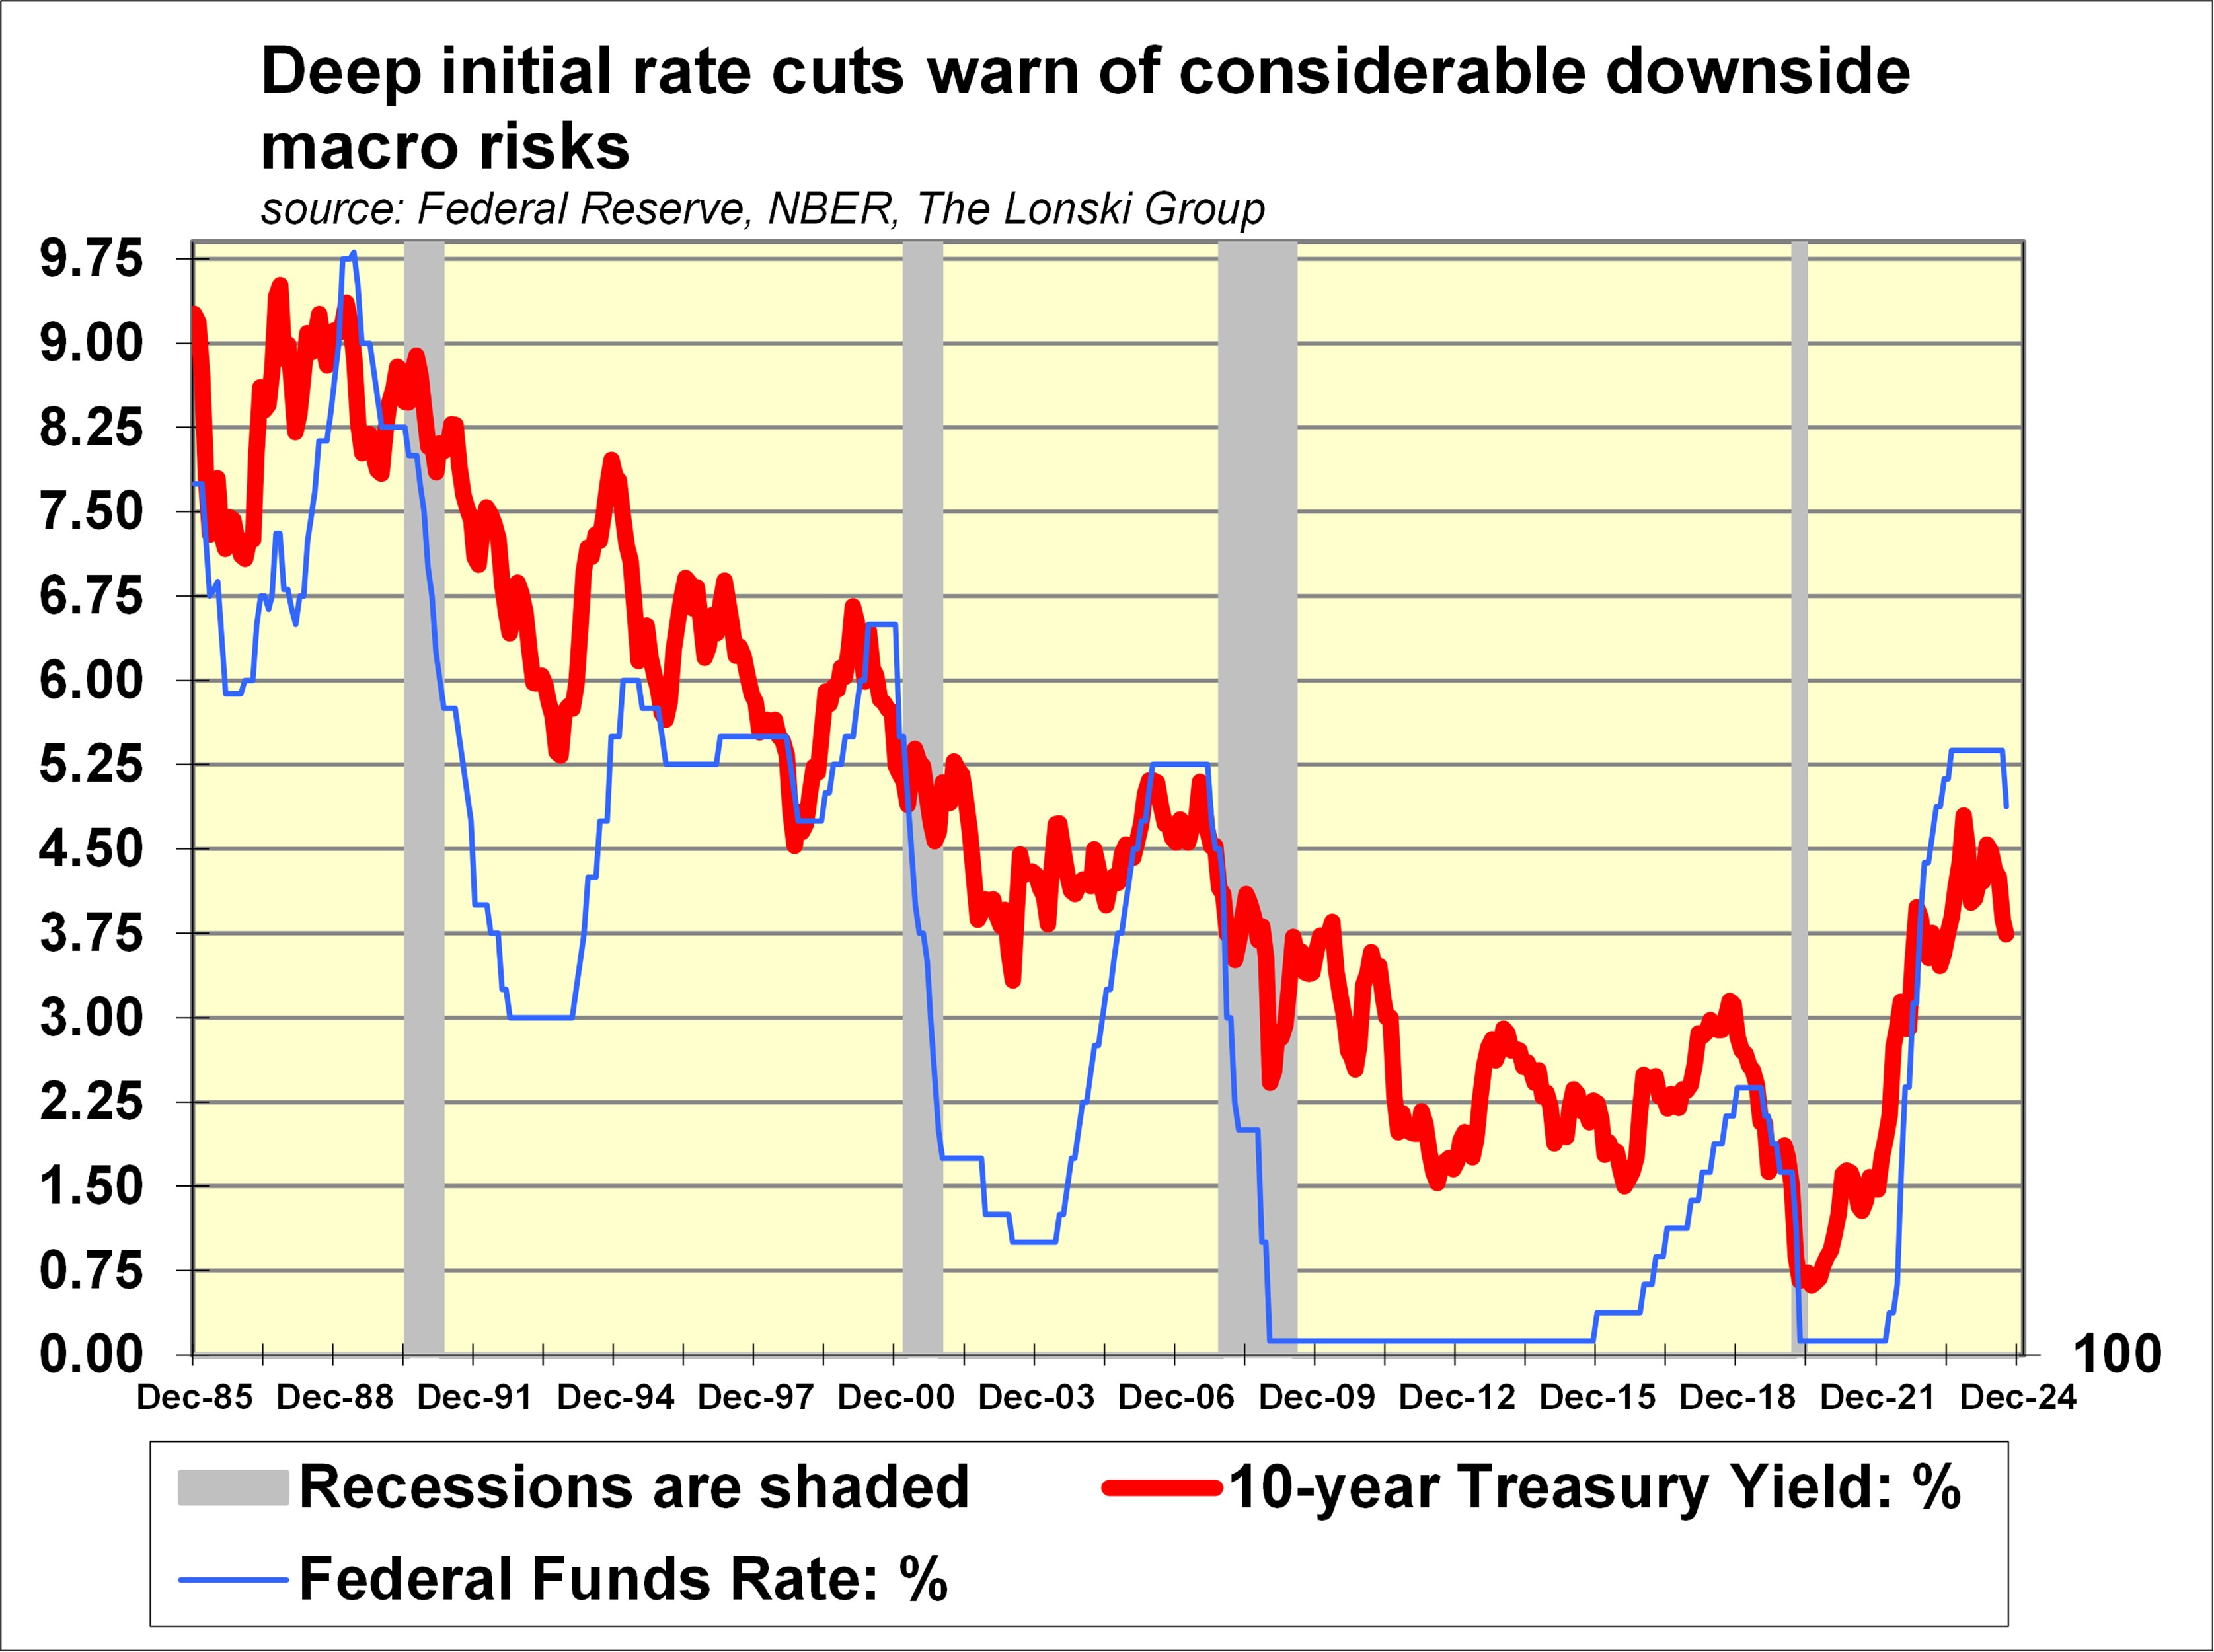
The failure thus far by September 18’s deep half of a percentage point cutting of the federal funds rate to prompt material declines by the 5- and 10-year Treasury yields limits the stimulatory effect of the latest Fed rate cut. The Fed’s latest move has yet to “open the floodgates for home sales” according to how the 10-year Treasury yield has risen from its pre-September 18 reading to a recent 3.74%. Moreover, the 5-year Treasury yield, which is an important benchmark for business borrowers, has increased from a pre-rate cut close of 3.44% to a recent 3.49%.
The 10-year Treasury yield does not always fall alongside a decline by the federal funds rate. The less the 10-year Treasury yield sinks in conjunction with Fed rate cuts, the Treasury bond market (i) believes Fed rate cuts alone will keep the US close to full employment and (ii) senses a rise in inflation risks arising from monetary stimulus. However, the Treasury bond market’s unwillingness to heed the messages of previous deep rate cuts typically is followed by a deterioration of business activity that ultimately drives Treasury bond yields sharply lower.
Earlier failures by benchmark Treasury bond yields to drop in concert with sizable declines by the federal funds rate helped to usher in recessions that Fed rate cuts were intended to prevent.
Treasury bonds incorrectly scoffed at January 2001’s percentage point cut in fed funds …
When the initial Fed rate cut of January 2001 was a full percentage point slashing of the federal funds rate from December 2000’s 6.5% to January 2001’s 5.5%, the 10-year Treasury yield’s month-long average barely dipped from December 2000’s 5.24% to January 2001’s 5.10%. After a half of a percentage point rate cut to March 2001’s 5.00%, the 10-year Treasury yield’s monthlong average fell to 4.89%. Thereafter, the 10-year Treasury yield resumed a climb that lifted its monthlong average to May 2001’s 5.39%.
Despite how the federal funds rate plunged from December 2000’s 6.50% to May 2001’s 4.00%, the average 10-year Treasury yield actually rose from December 2000’s 5.24% to May 2001’s 5.39%.
The Treasury bond market failed to recognize a fundamental weakening of macroeconomic conditions. In fact, the National Bureau of Economic Research (NBER) later declared that a recession had begun in March 2001. The dive by the federal funds rate was a much better predictor of the nearness of a recession compared to the 10-year Treasury yield’s contrarian’s climb.
The 10-year Treasury yield’s refusal to sink alongside the federal funds rate added to downside macroeconomic risks.
Though the 30-year mortgage yield’s monthlong average eased from December 2000’s 7.32% to May 2001’s 7.16%, the decline was not deep enough to fend off the 2001 recession. How disappointing that a -2.50 percentage point plunge by fed funds could deliver only a -0.16 percentage point dip by the FHLMC’s 30-year mortgage yield.
Treasury bond yields were slow to react to deep rate cuts that forewarned of Great Recession …
The first federal funds rate cut prior to the Great Recession was September 2007’s -50 basis points cut from 5.25% to 4.75%. Immediately thereafter, fed funds was lowered by -25 basis points to October 2007’s 4.50%. In response, the 10-year Treasury yield’s month-long average fell from August 2007’s 4.67% to September 2007’s 4.52% but then edged up to October 2007’s 4.53%. From August 2007 to October 2007, the 10-year Treasury yield eased by only -14 basis points (bp) notwithstanding the much deeper -75 bp plunge by fed funds.
The behavior of Treasury bond yields does not offer reliable insight regarding the future pace of economic activity. In general, financial markets have a mixed record as far as predicting the US economy’s near-term course.
Some tines, the Treasury bond market waits for the equity market to sink before responding more fully to deep Fed rate cuts. It was only after the equity market peaked in October 2007 that the 10-year Treasury yield began another drop that took the benchmark to a May 2008 low of 3.51%. Bizarrely enough, despite a recessionary backdrop, the 10-year Treasury yield’s month-long average climbed back up to June 2008’s 4.10% before beginning a deep descent that took the average yield to December 2008’s Great Recession low of 2.42%.
September 18’s -50 bp slashing of fed funds will not quickly trigger a noteworthy drop by the 30-year mortgage yield. Because the 30-year mortgage yield is priced off of the 10-year Treasury yield, the rise by the 10-year Treasury yield from a September 17 close of 3.65% to a recent 3.74% warns that the FHLMC’s latest 30-year mortgage yield of 6.09% may not fall materially notwithstanding the half of a percentage point cutting of fed funds.
The Treasury bond market fears that the depth of September 18’s rate cut suggests the Fed has become too dismissive about inflation risks in an economy that is still near full employment. The bond market senses that an unduly aggressive relaxation of monetary policy might reverse the now declining trend of consumer price inflation.
Major relief for home affordability requires less-than-3% 10-year Treasury yield …
If the 10-year Treasury yield drops to 3.0%, the 30-year mortgage yield might approximate 5.5%. After factoring in a 3% yearly increase for the median price of existing homes sold, the estimated monthly mortgage payment drops to $1,810.
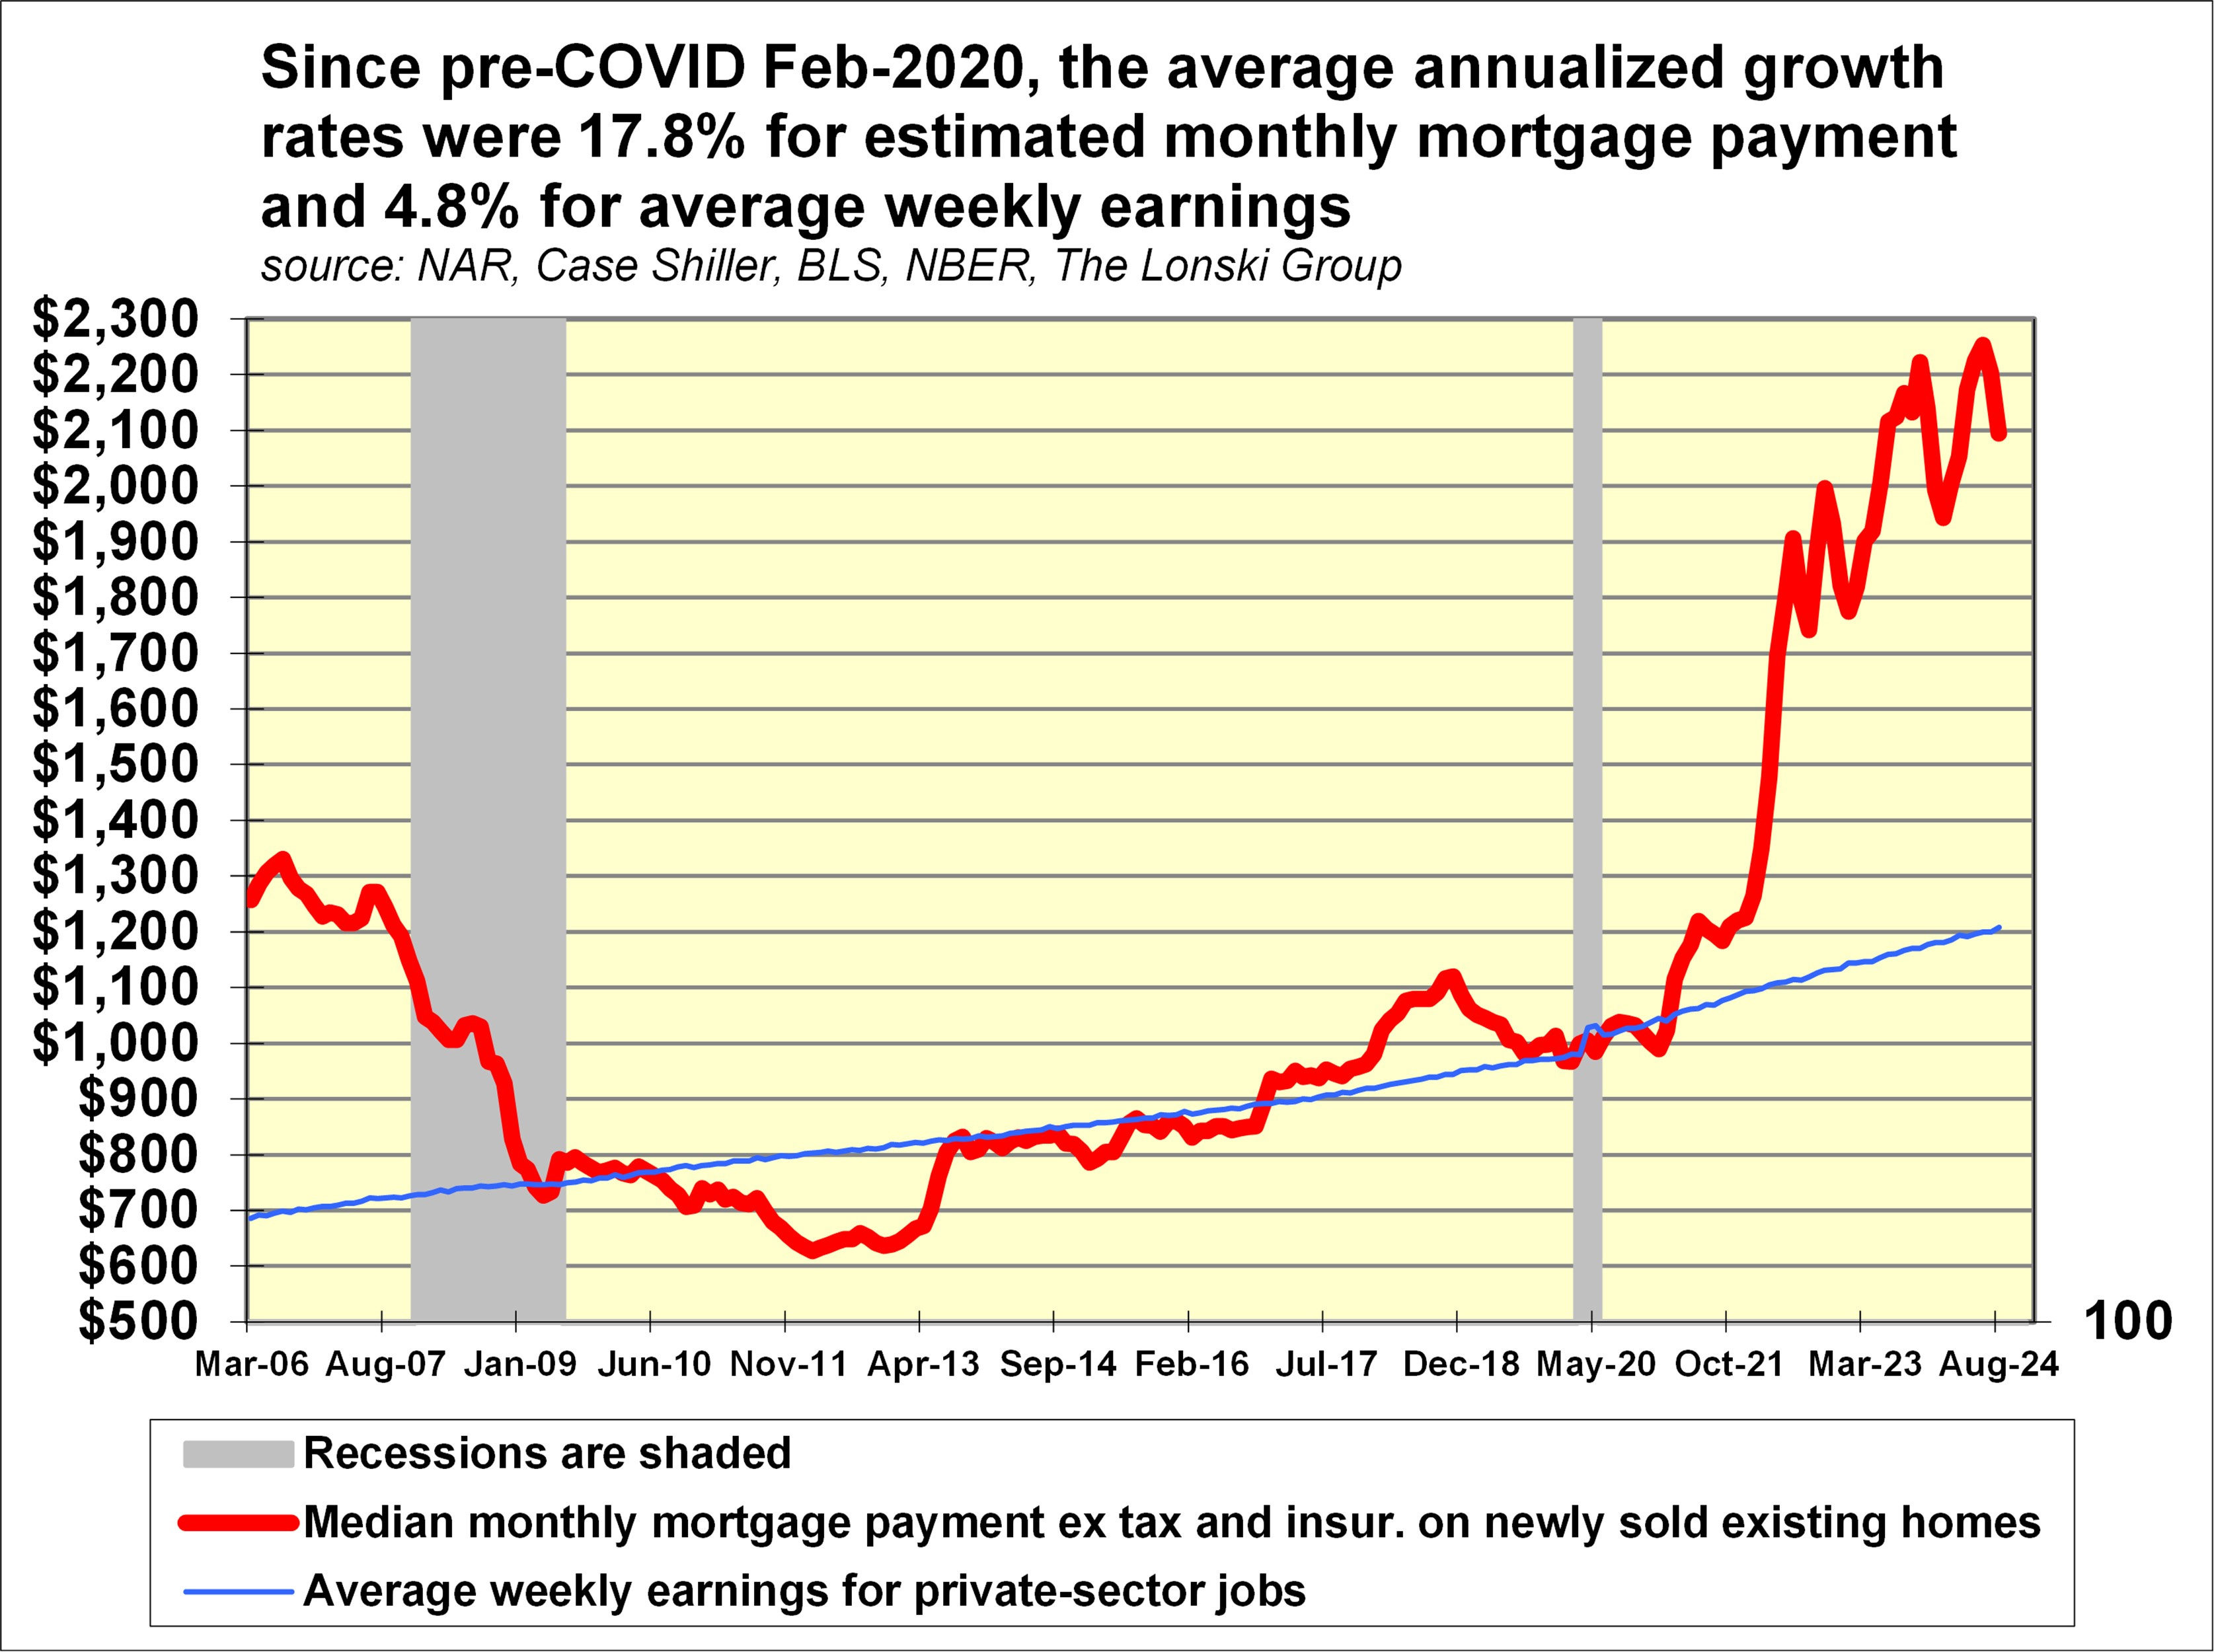
Though down considerably from the $2,119 monthly average of the year ended June 2024, an $1,810 monthly mortgage payment would roughly match its $1,839 monthly average of the year-ended March 2023, or when sales of existing homes proceeded at an annualized pace of 4.664 million units. By contrast, the annualized pace of existing home sales averaged 5.330 million units during 2018-2019.
A drop by the 30-year mortgage yield from a recent 6.09% to 5.5% by the end of 2024 would not return home affordability to levels that held prior to COVID. For example, the ratio of the median monthly mortgage payment on a newly sold existing home to average weekly earnings may drop from the 1.78:1 average of the year-ended August 2024 to 1.50:1 if the 30-year mortgage yield falls to 5.5%. Though a ratio of 1.50:1 also compares favorably with the 1.63:1 average of the year-ended March 2023, it would still be well above the 1.10:1 average of 2018-2019.
Unless employment income soars, home price deflation looms …
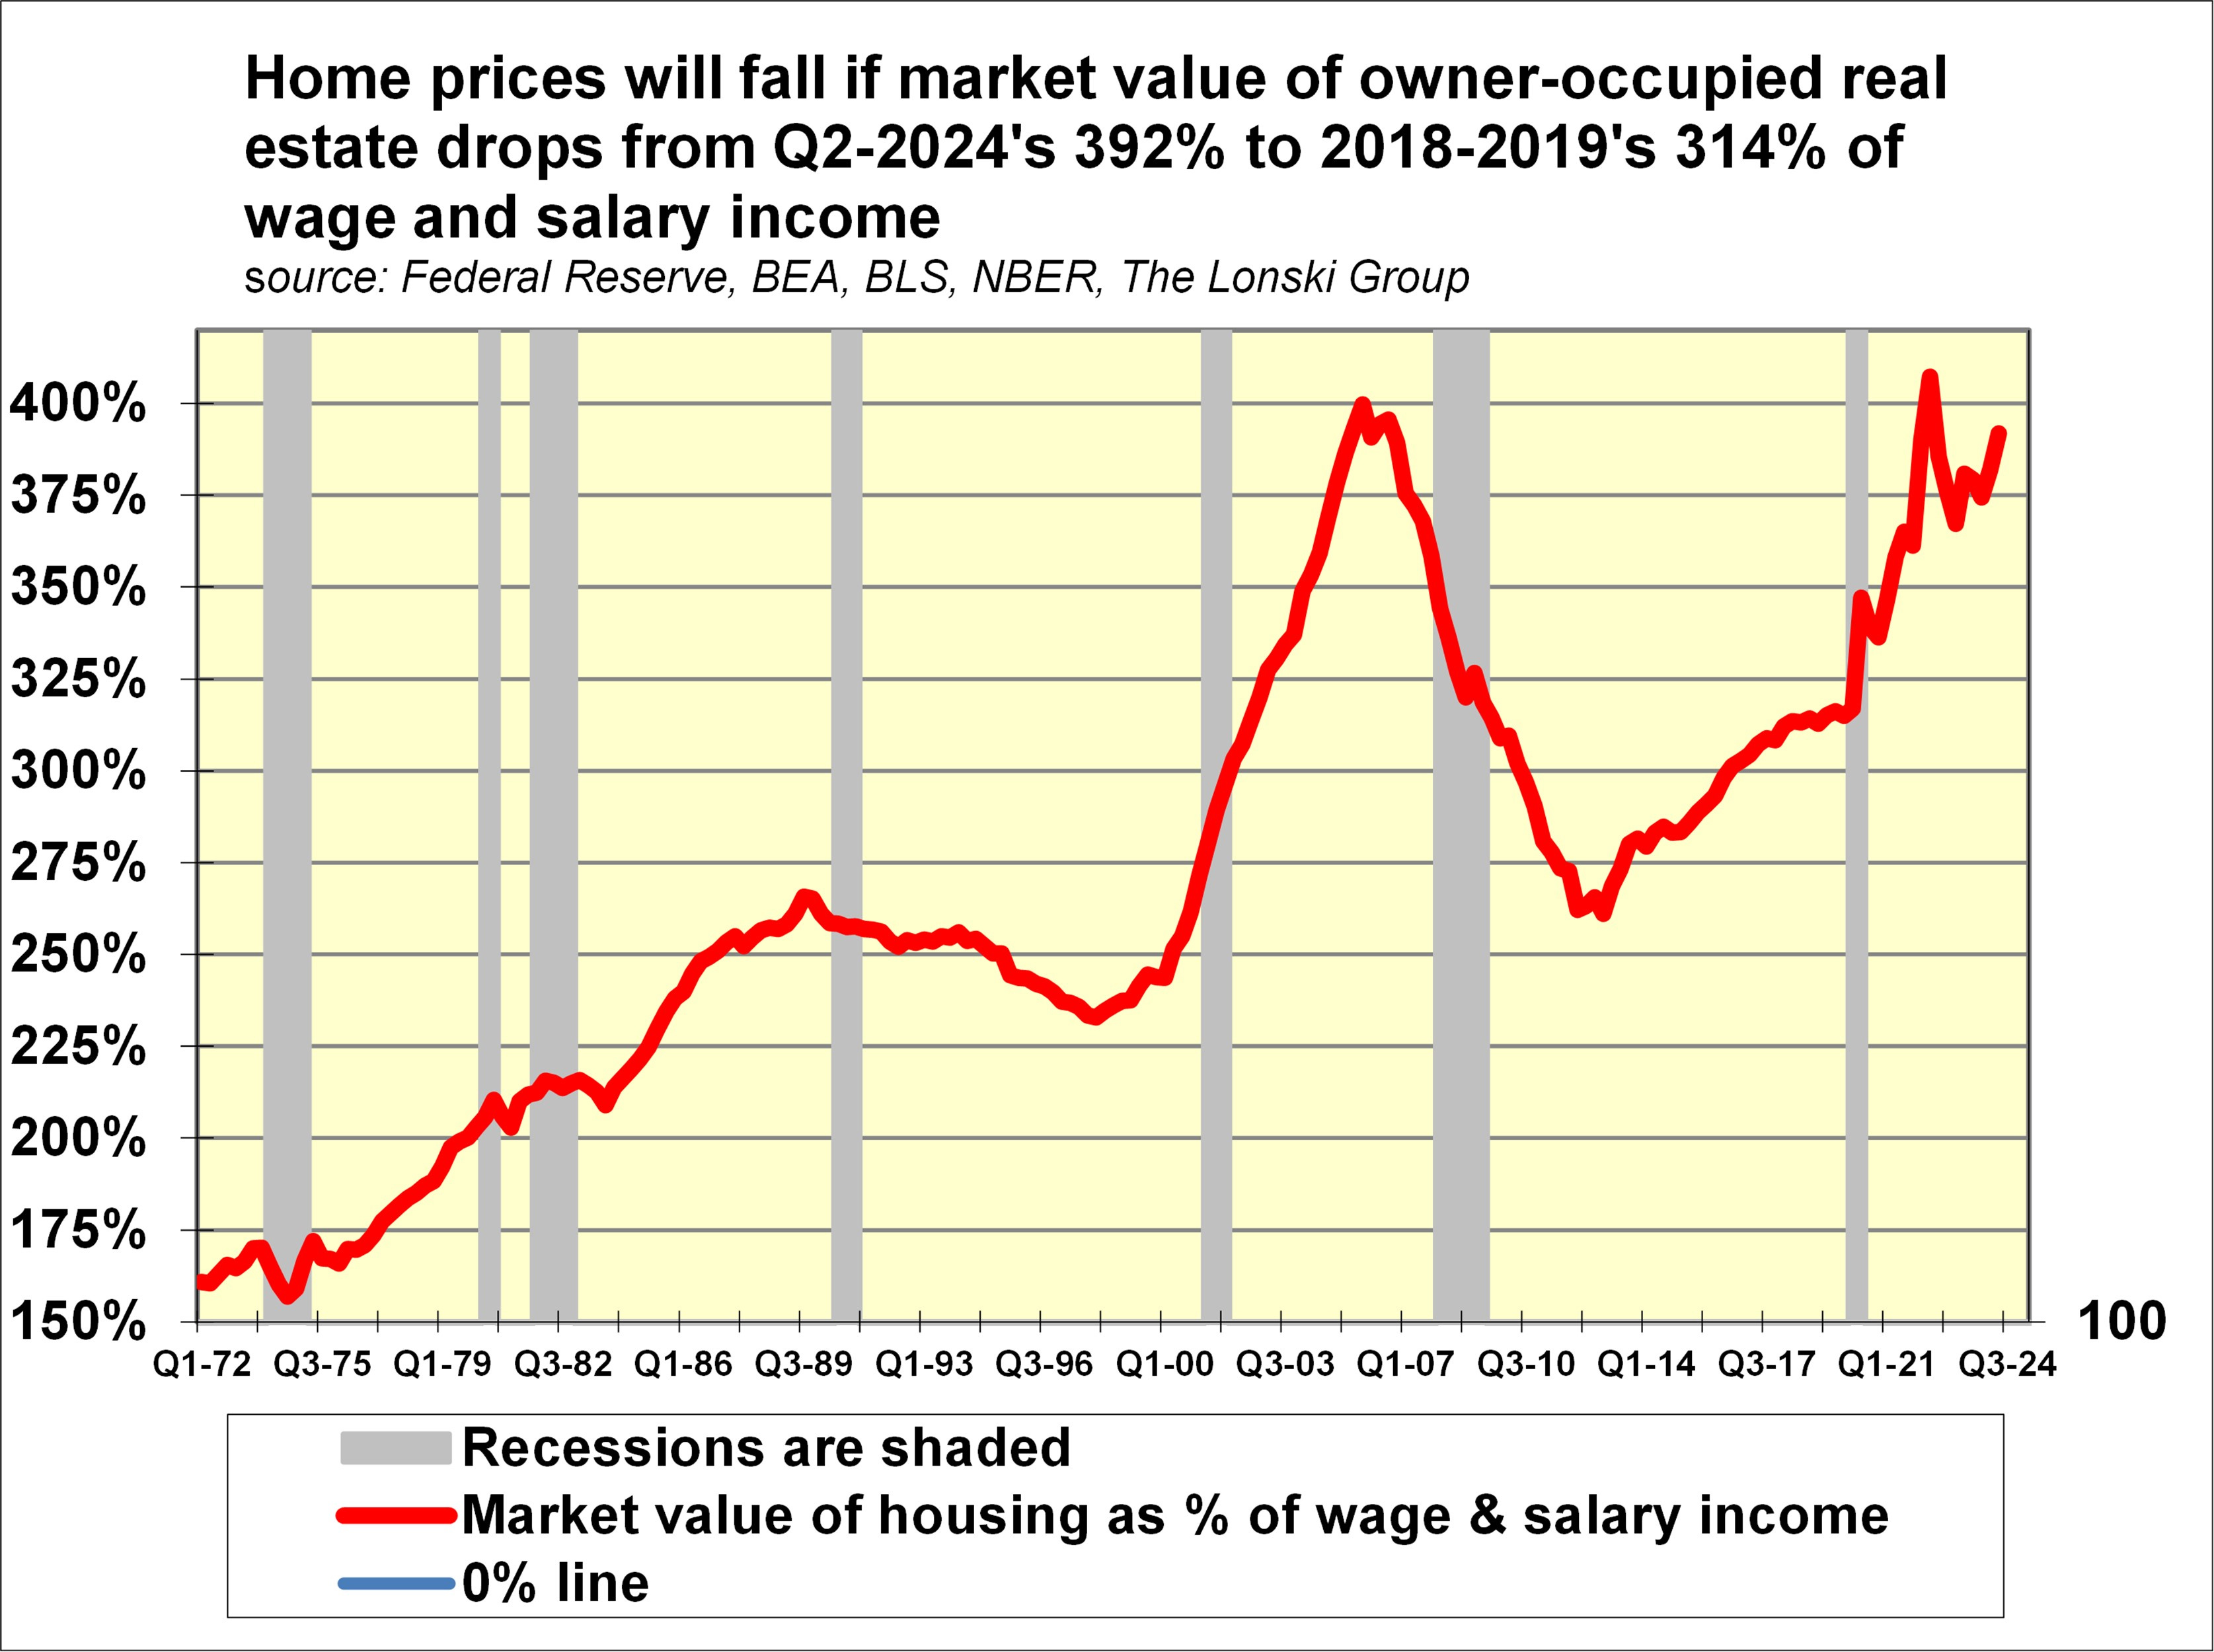
Since 2019’s final quarter, the cumulative 61% advance by the market value of owner-occupied residential real estate doubled the cumulative 30% increase by wage and salary income. In turn, the market value of owner-occupied residential real estate jumped up from 2018-2019’s 314% to Q2-2024’s 392% of wage and salary income. What is remarkable about the ratio’s lift-off was how it occurred despite a jump by the FHLMC’s 30-year mortgage yield from its 4.24% average of 2018-2019 to the 6.99% of 2024’s second quarter.
In response to the drop by the 10-year Treasury yield from Q2-2024’s 4.44% average to the 3.66% of the week-ended September 19, the 30-year mortgage rate recently fell to a still relatively high 6.09%. A subsequent rise by the 10-year Treasury yield to a recent 3.74% suggests that despite September 18’s -50 basis points reduction in fed funds, the 30-year mortgage yield has yet to approach 6%. Moreover, a notably lower 30-year mortgage yield may do little to enhance home affordability if lower mortgage yields help to lift home prices.